3 Clustering
Check out the user manual for more details about this module’s features.
Hierarchical clustering
Use the cluster >> hierarchical module to overview an unsupervised grouping of the data.
Methods
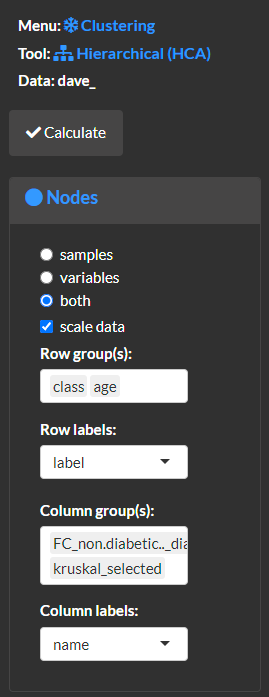
Specify the node properties and what dimensions of the data (samples (rows), variables (columns) or both) to cluster. For example, the selected options will cluster both rows and columns, scale the data based on subtraction of column means and division of column standard deviations, annotate the heat map to show class and age for samples and fold-change of means for class and significantly altered variables.

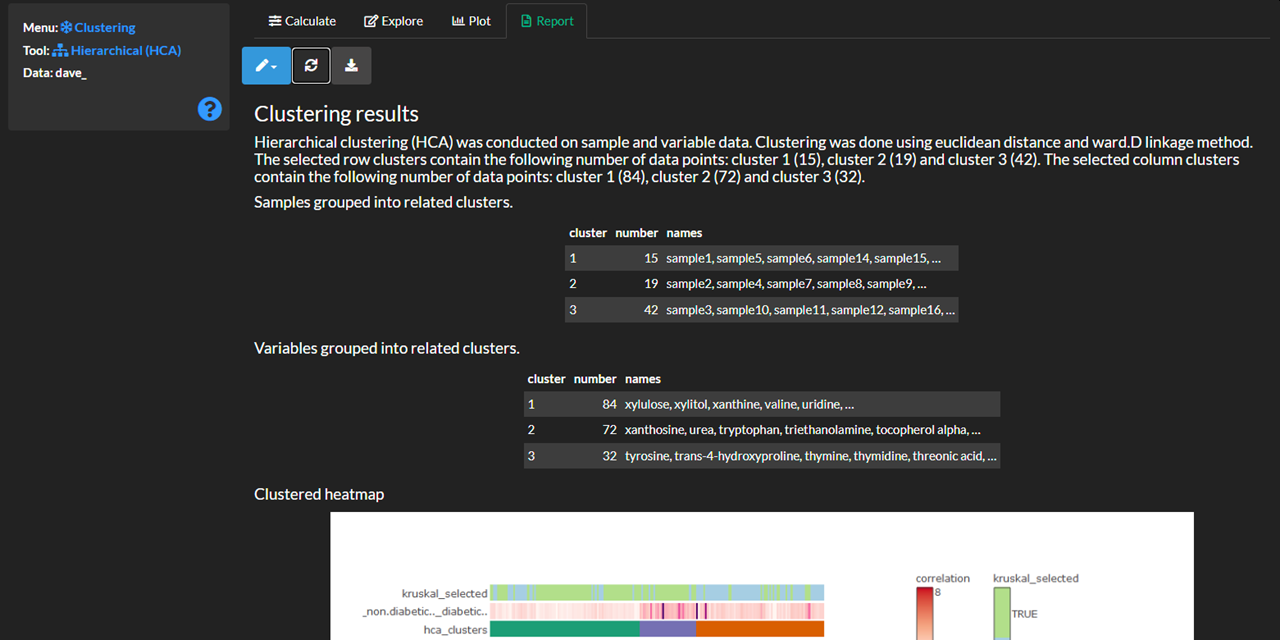
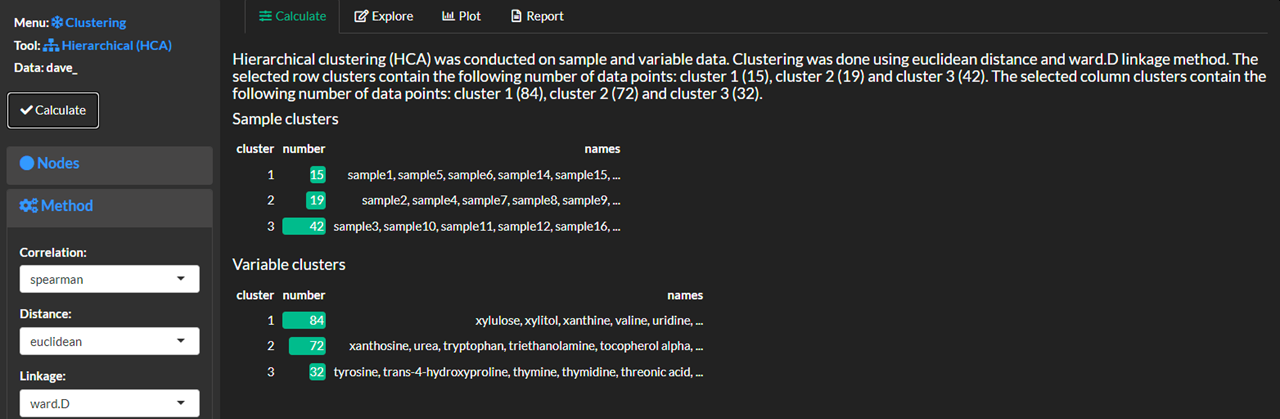
Select calculate and view the cluster analysis methods and results.
Explore and plot
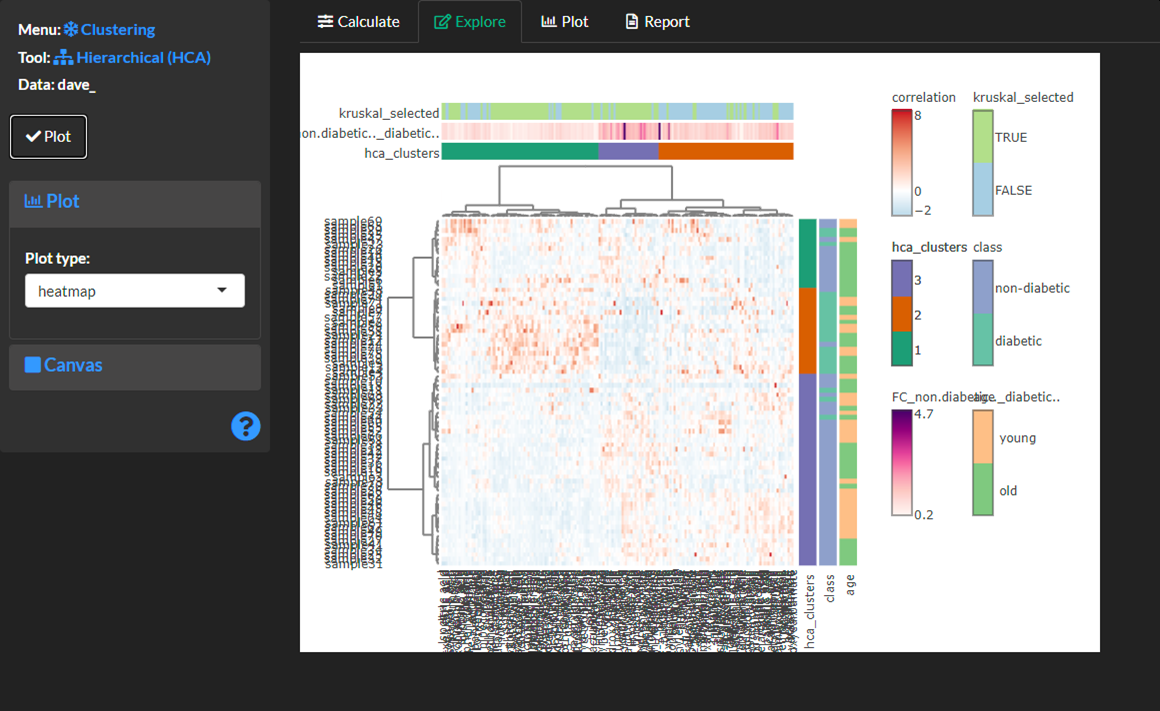
Create a heatmap or dendrogram to view the clustering results. Note, dendrograms are plotted separately for samples and/or columns.
Heatmap displaying hierarchical clusters for samples and/or variables.
Dendrogram displaying hierarchical clusters for samples.

Dendrogram displaying hierarchical clusters for variables.

Report