Network mapping 101 course in review
Course Organization
This October I was lucky enough to teach an advanced metabolic data analysis course in collaboration University of California, Davis.
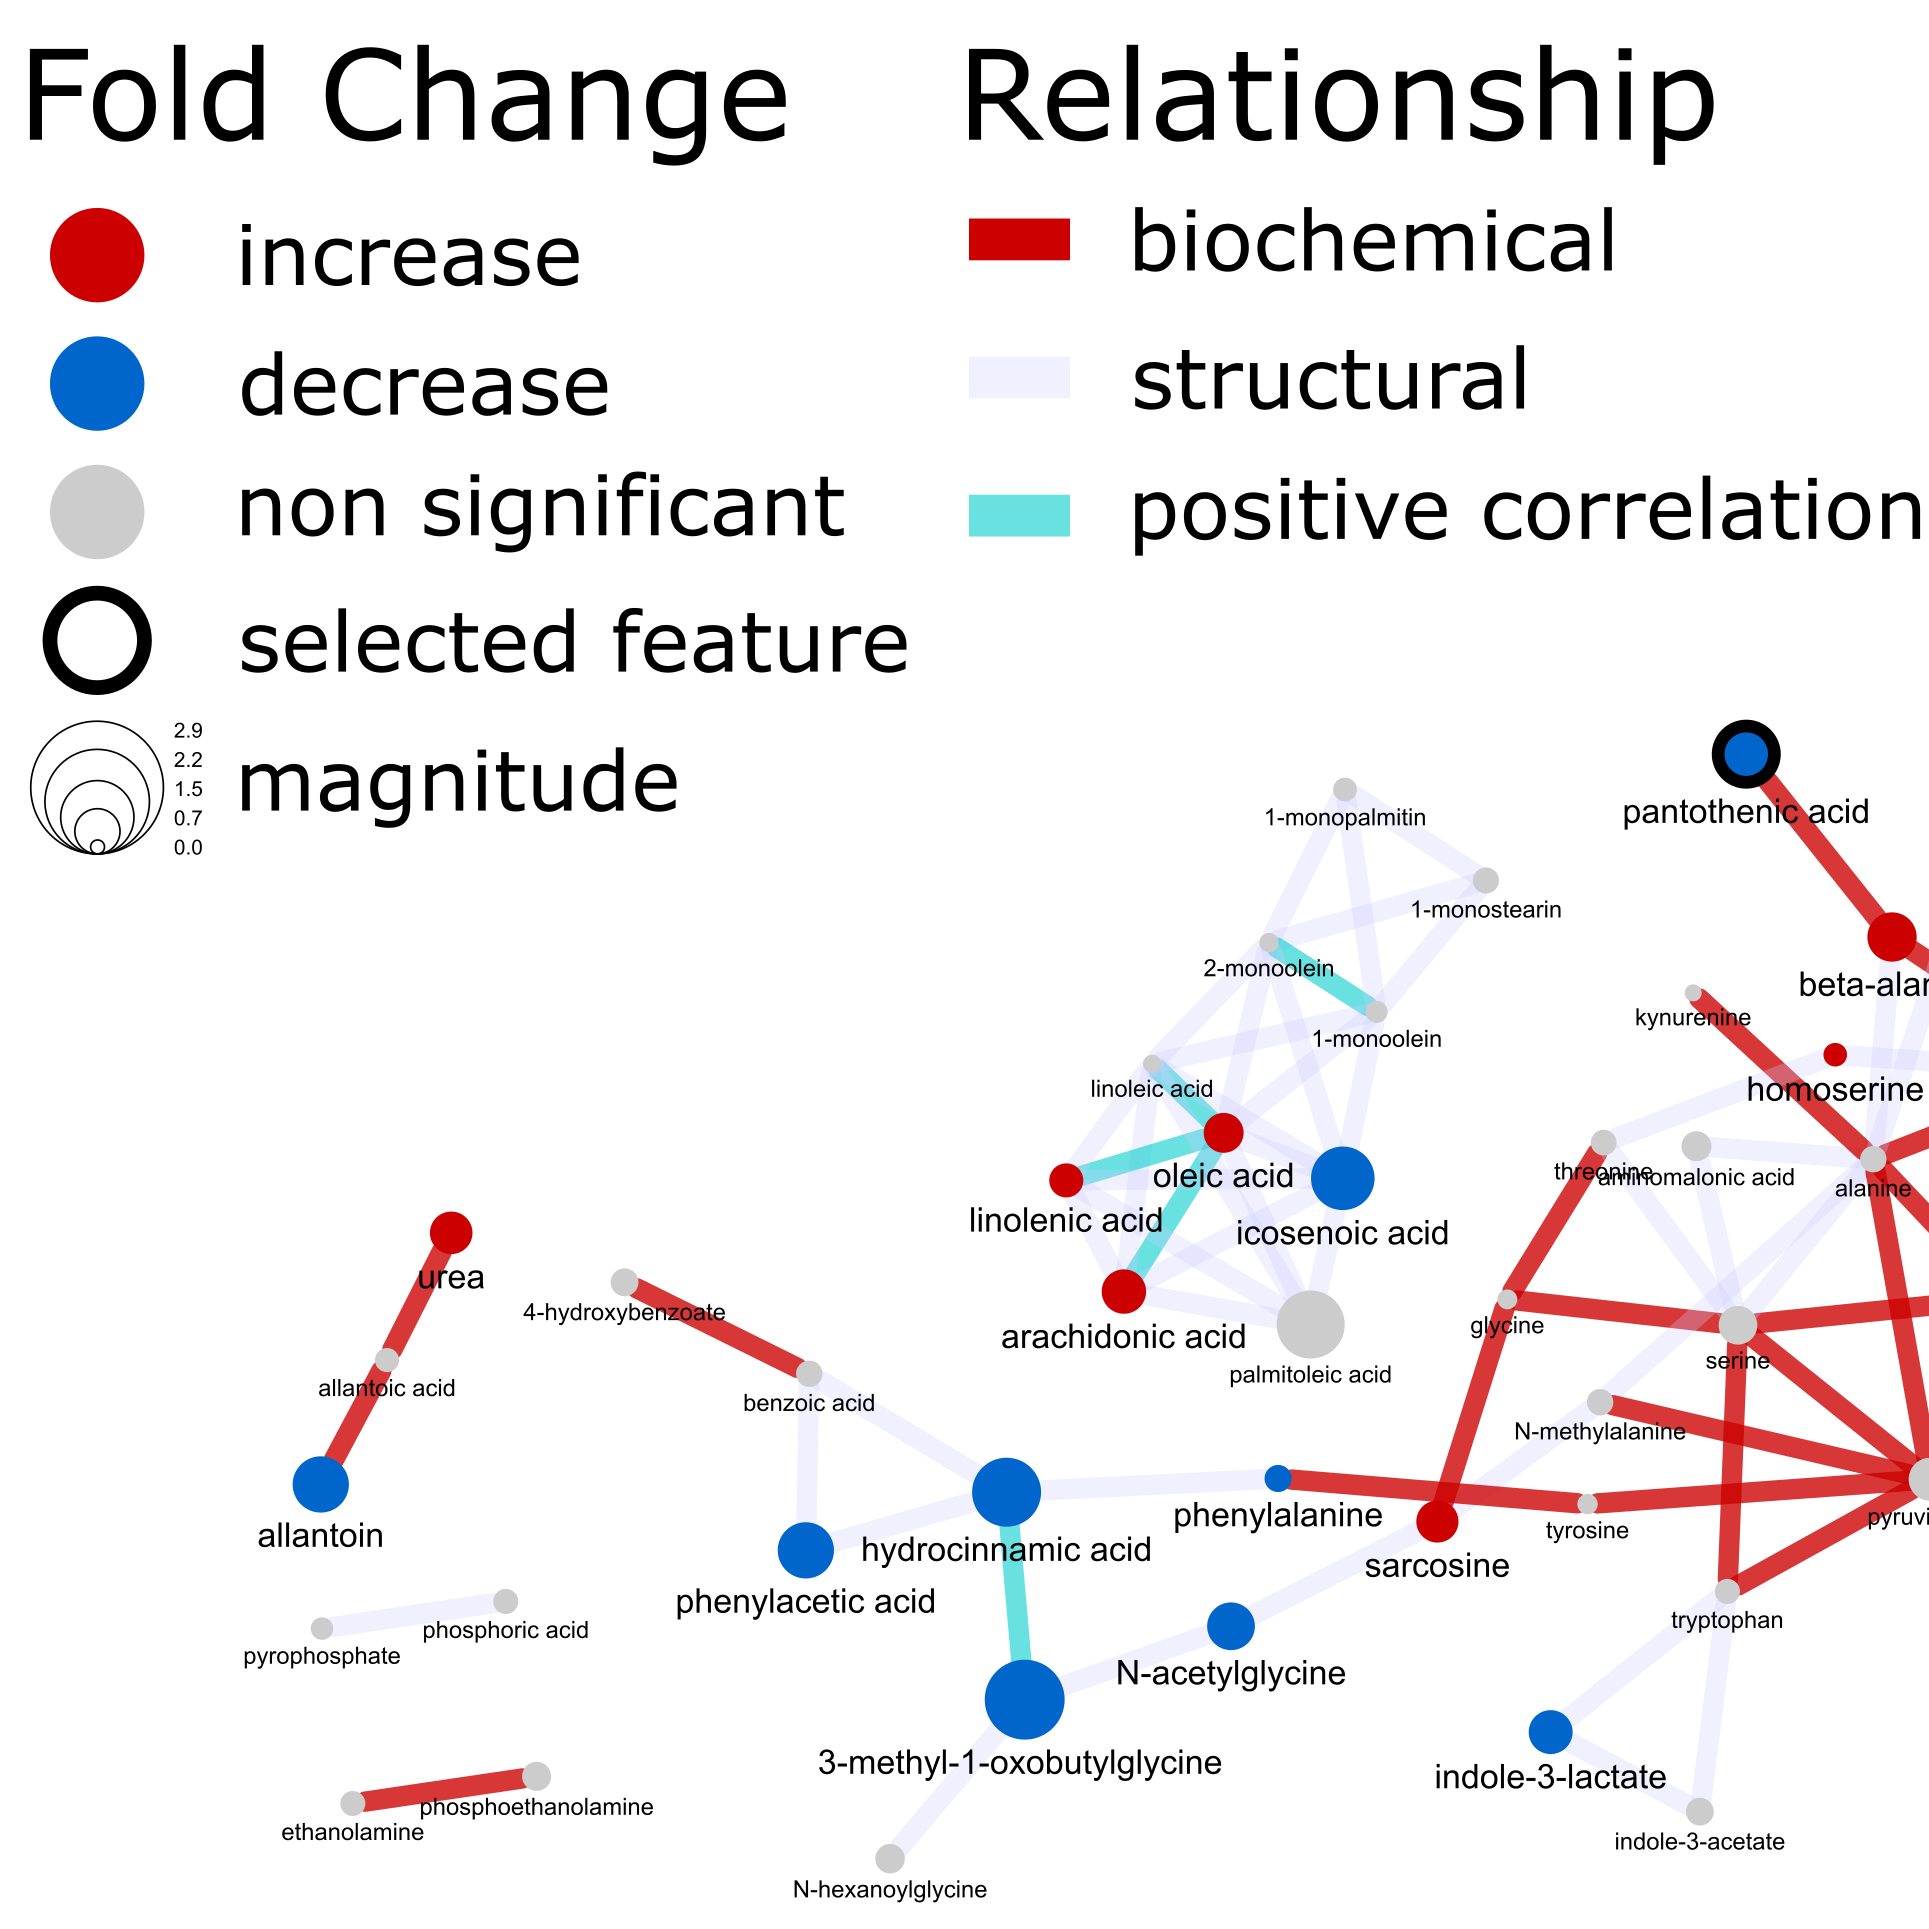
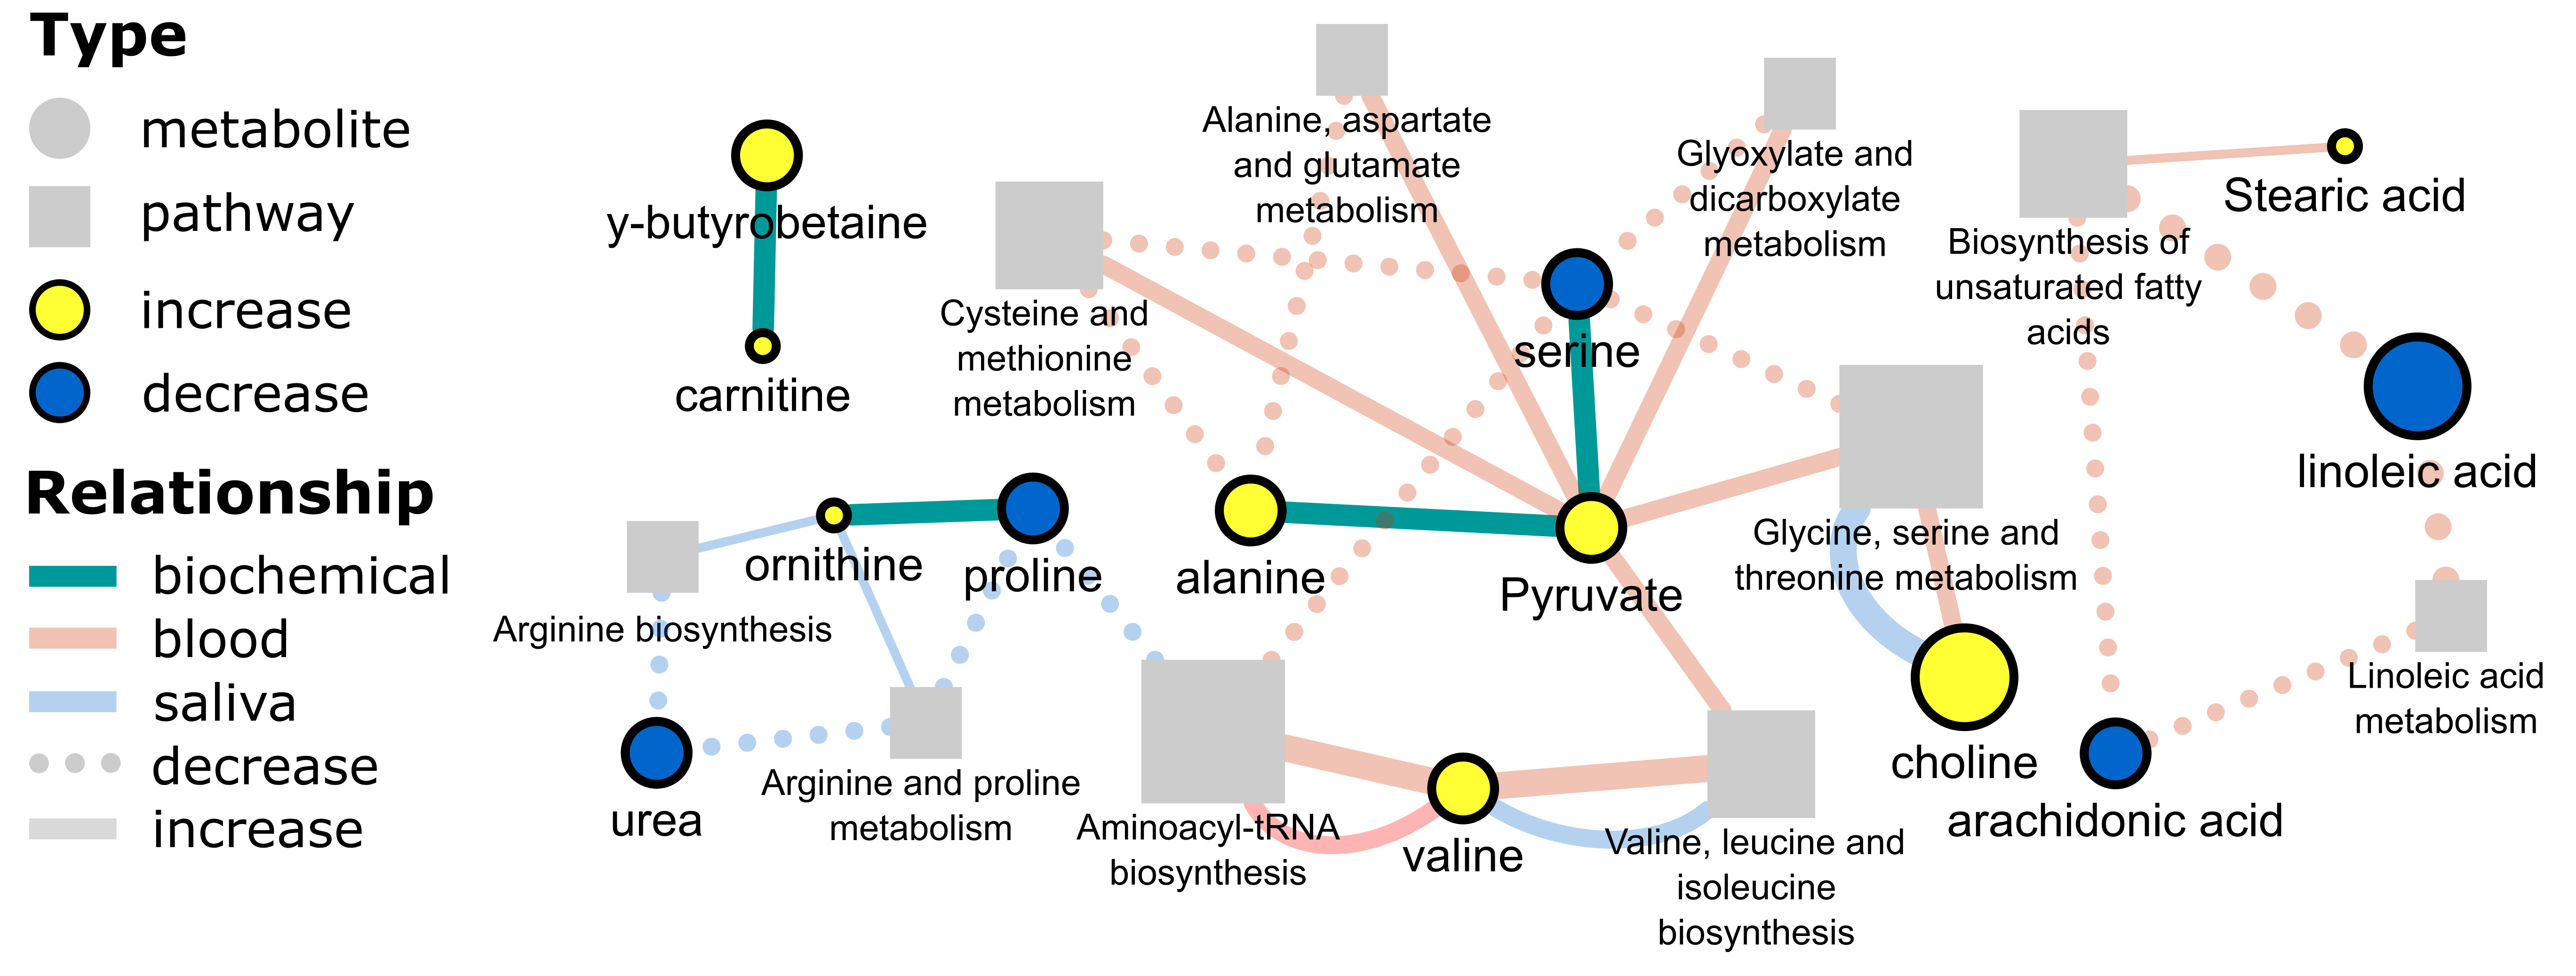
The goal was to create the following network.
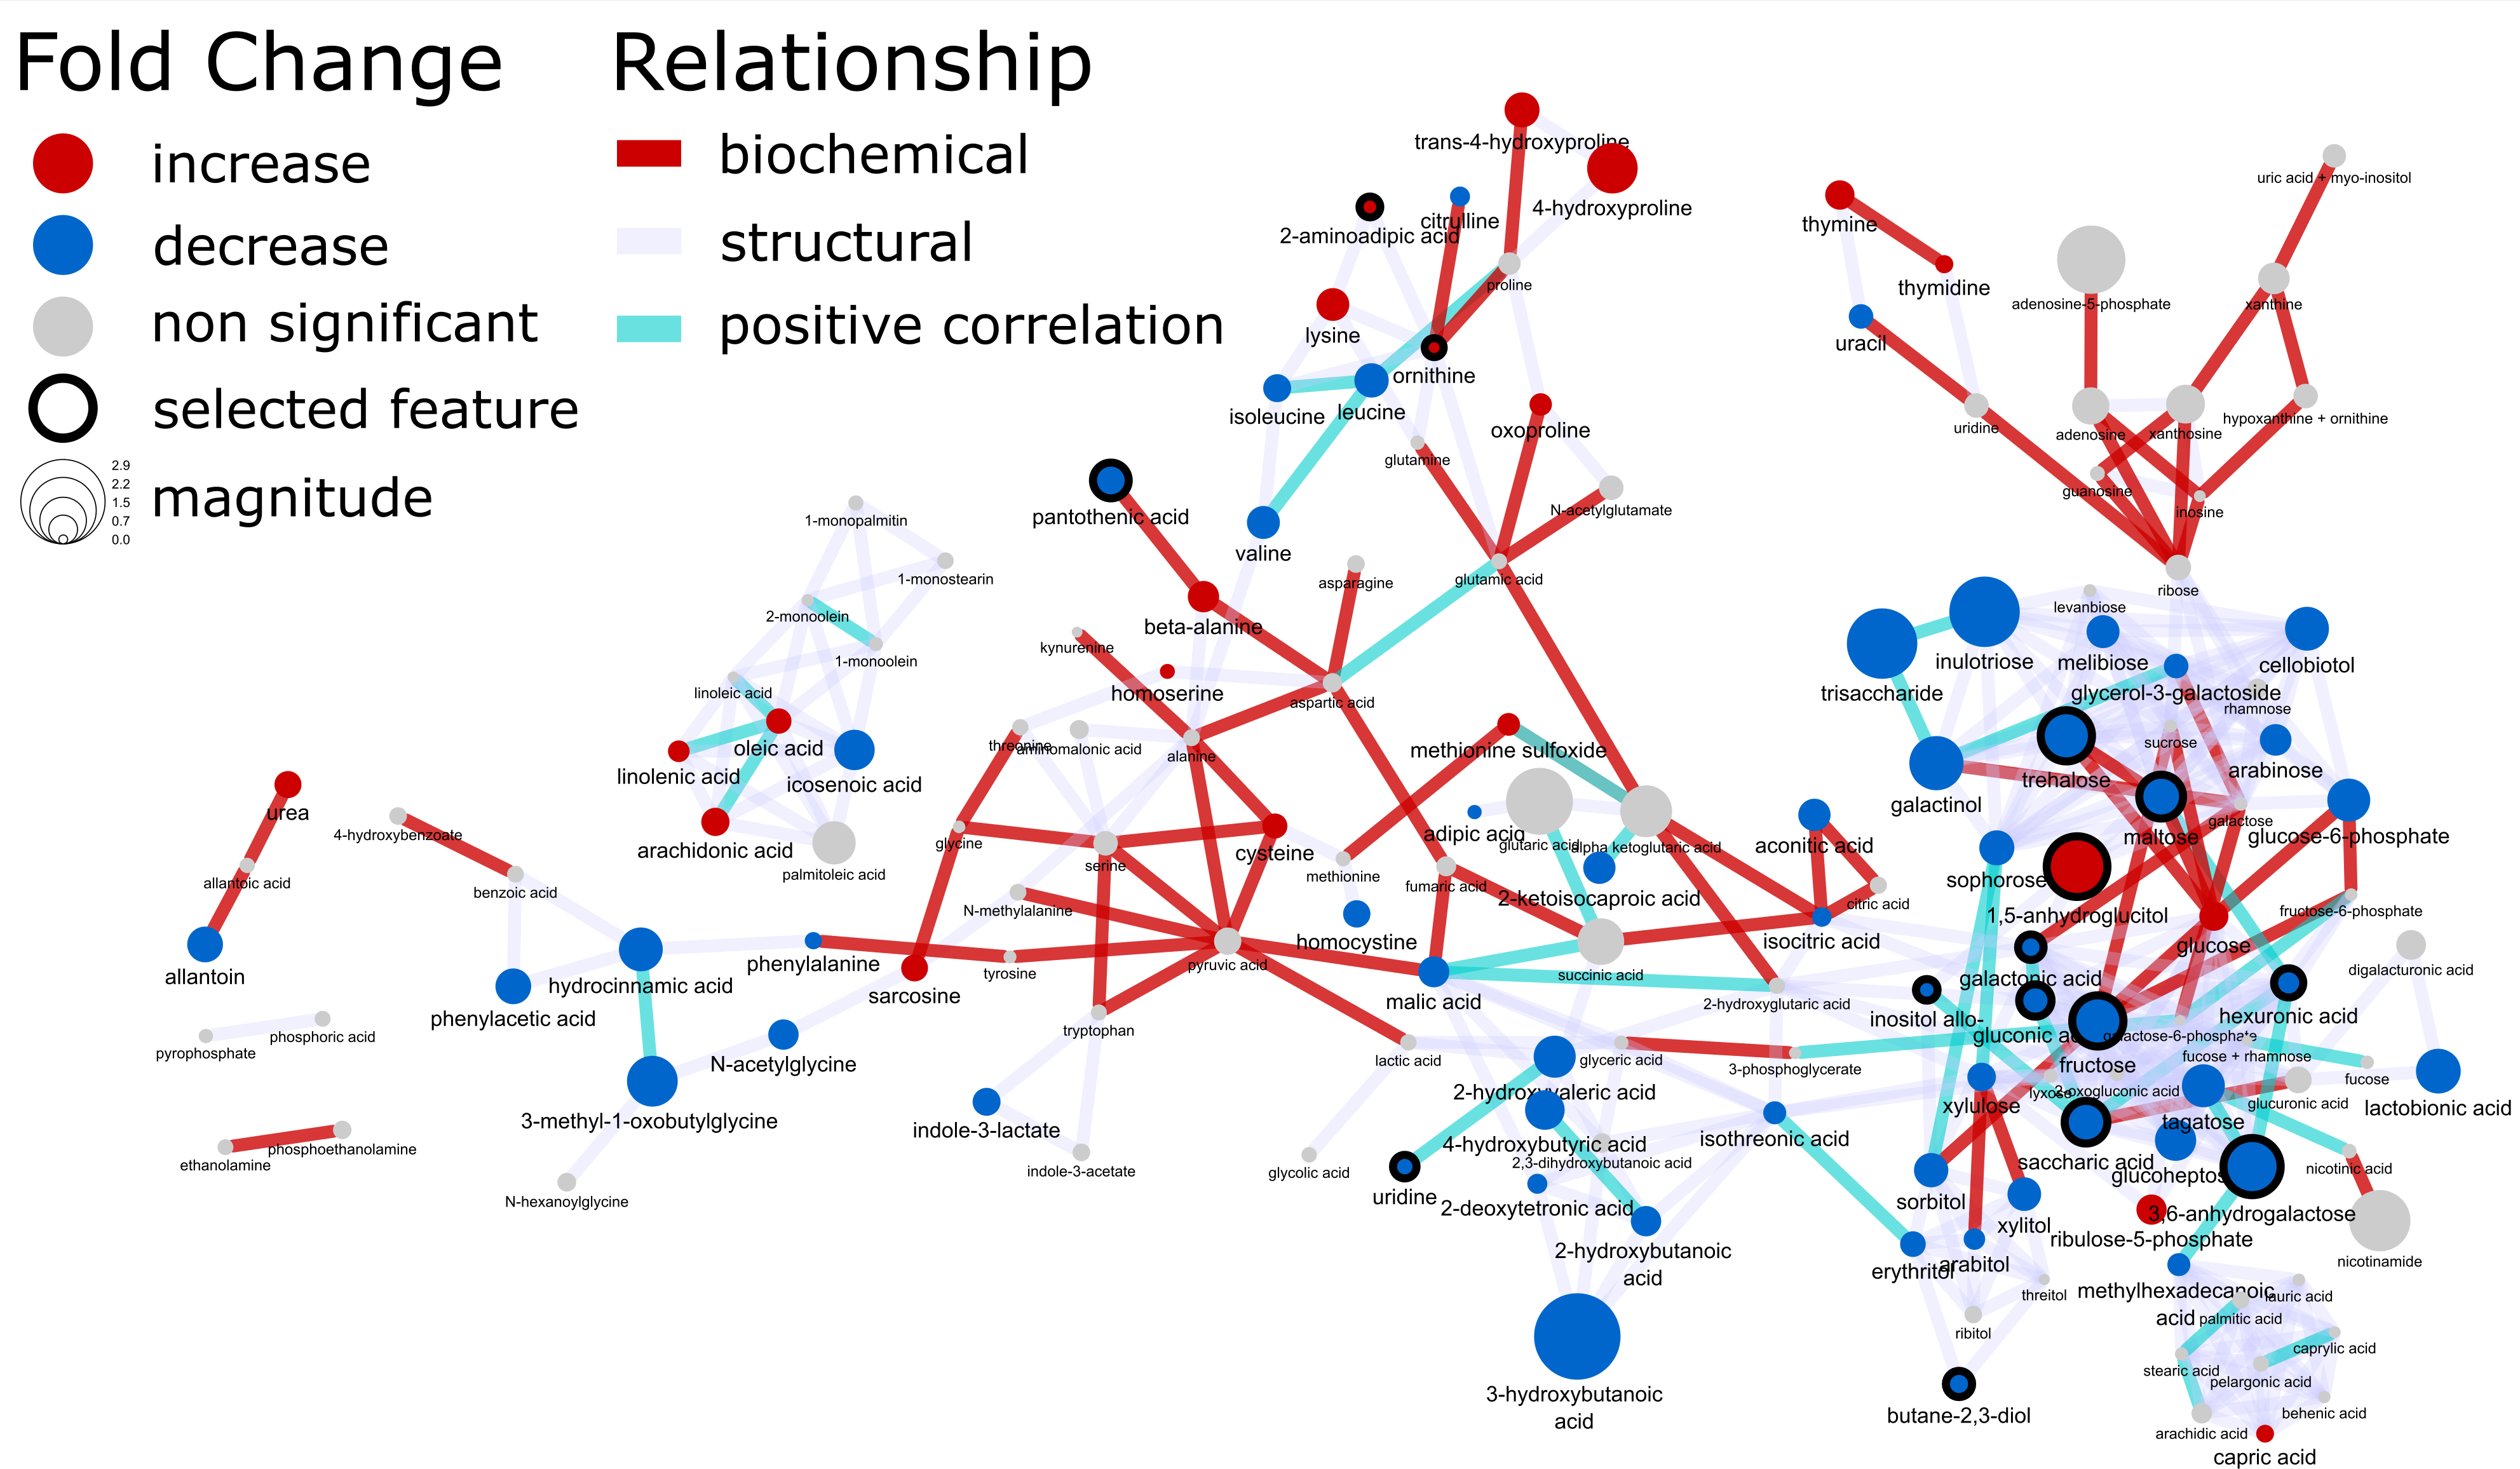
The course covered all of the steps required to go from raw data to a rich mapped biochemical network incorporating statistical, multivariate and machine learning results. This included examples and tutorials for:
- Preparing raw data for analysis
- Multivariate data exploration
- Supervised clustering
- Machine learning – classification model validation and feature selection
- Network analysis - biochemical, structural similarity and correlation networks
- Network mapping – putting it all together to create a publication quality network
Course Software
During this course, the participants used DAVe - Data Analysis and Visualization engine to recreate all analyses results. The final networks were rendered using Cytoscape and prepared for publication using Inkscape.
Development
This course was a great motivator to push CDS software development to release the first free publicly available version of DAVe.
Quick history of DAVe
The current iteration of DAVe is the culmination of a long journey which began around the year 2010.
Everything started when I was first exposed to programming. This occurred while I was completing my PhD graduate work at UC Davis. While I was working on my PhD thesis on Application of Targeted Metabolomic Profiling and Multivariate Data Analysis for the Study of Nutrition and Disease. I took a statistical analysis course which was taught in R. I fell in love with coding and my PhD quickly included building multivariate data analysis add-ins for Excel. The first iteration was a Frankenstein of visual basic and R. ImDEV - Interactive modules for Data Exploration and Visualization was born.

I am overjoyed that this tool has been downloaded in 131 countries over 16,000 times.

Looking back, I am very grateful for the opportunity to blindly learn to recreate countless wheels (no CS training, machine learning or IDE with syntax highlighting).
While ImDEV was powerful and unique (is there any other way to create 3D networks in excel?) it was hard to install and even harder to maintain for the many possible versions of Excel.
Next, DeviumWeb - Dynamic MultivariatE Data Analysis and VIsUalization PlatforM was born. This tool used R and the package shiny to create all of the UI.

While Devium was portable, it was still hard to install, requiring many R packages including those from Bioconductor. Devium also lacked integration with network calculation tools I created such as MetaMapR.

DAVe was made to easily execute the full metabolomic network mapping workflow. This tool uses a combination of OpenCPU microservices and a shiny UI. This makes it easier to install and maintain all of the code.

DAVe architecture has gone through many iterations including deployment as a kubernetes backed ShinyProxy application before arriving at its current form. My hope is that the current iteration combining API microservices and local shiny UI will provide the best compromise between user experience, rapid development and ease of maintenance.
While DAVe is an awesome tool, it requires upkeep. If you like this tool, please consider supporting it, which will help maintain all the servers!