DAVe, application interactively combines statistics, clustering, data exploration and visualization with machine learning, functional and network analysis to create information and context rich mapped networks. The following manual describes a selection of available workflows. Get ready to connect your data with context!
Modules
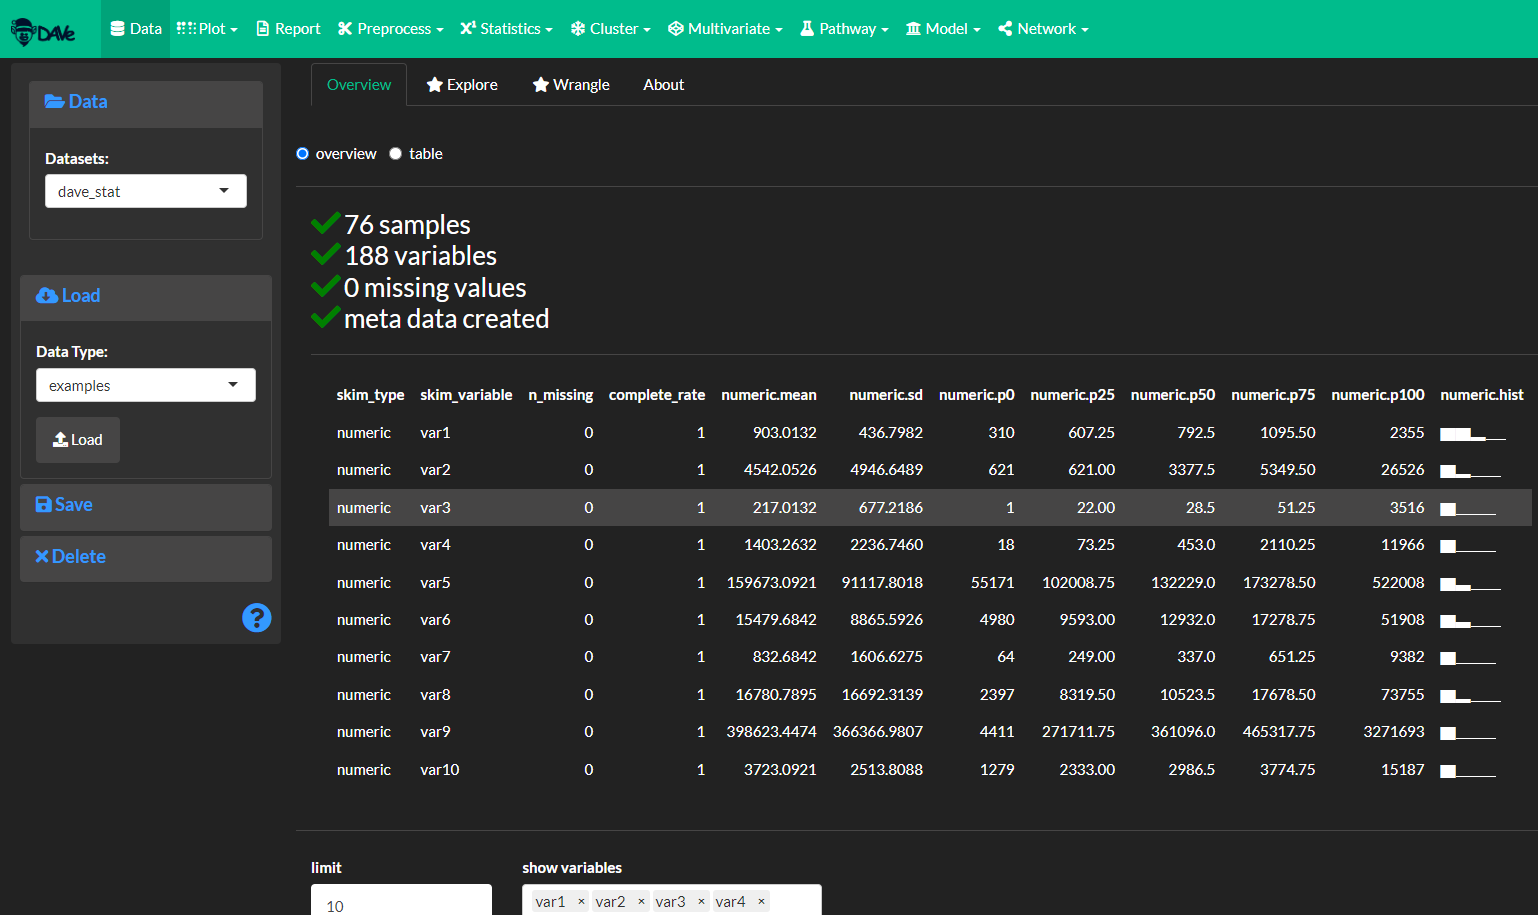
DAVe is comprised of 10 modules covering: data, plotting, pre-processing, statistics, clustering, dimensional reduction, pathway analysis, predictive modeling, network analysis and reporting domains. Each module contains a calculate, explore, plot and report components.
Actions
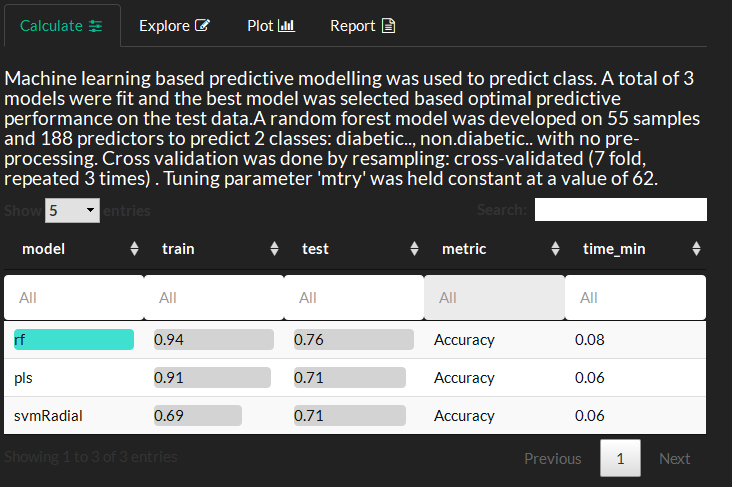
Calculate
This tab is used to set the method options and view the results summary and tabular output.
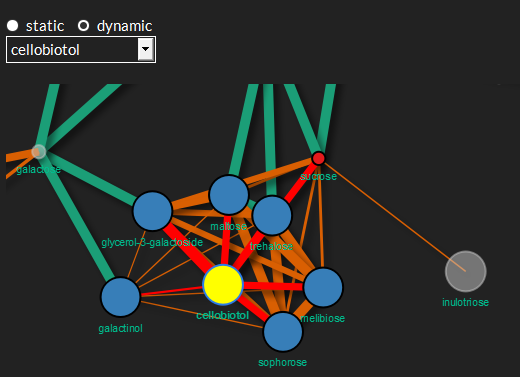
Explore
Interactively explore the results.
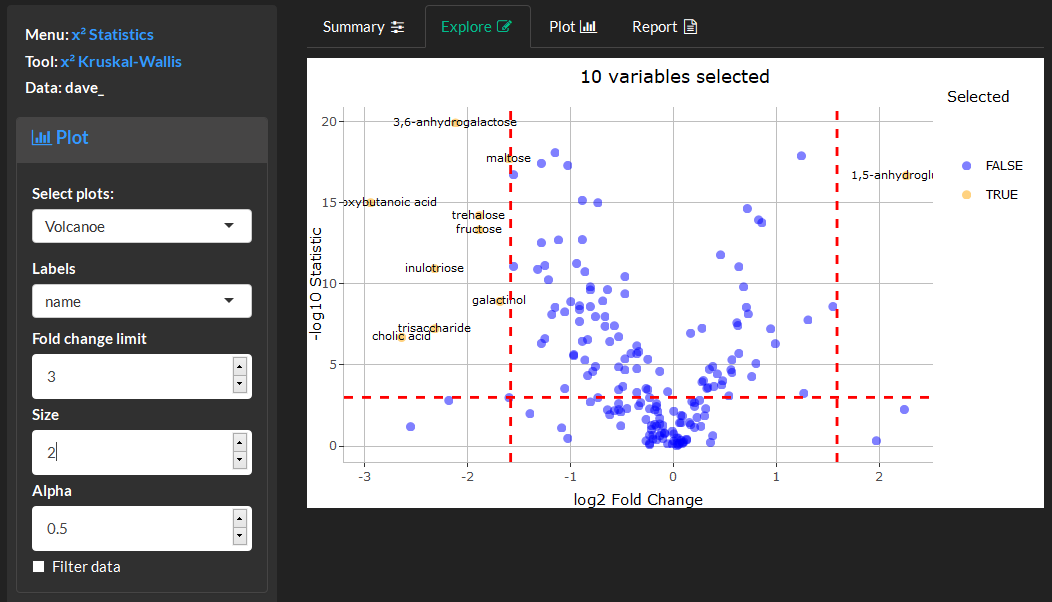
Plot
View and tune your data visualizations.
Report
Create data analysis summaries and reproducible reports.