Overview

%%{init: {'theme': 'dark'}}%%
graph LR

    1((Global Utilities)) --> data["fa:fa-database Data #9679;"];
    2((Modules)) -->1
    1 --> report["fa:fa-file-text-o Report #9679;"];
    1 --> vis["fa:fa-braille Plot #9679;"];
    2 --> preproc["fa:fa-scissors Preprocess #9679;"];
    2 --> stats["fa:fa-superscript Statistics #9679;"];
    2 --> path["fa:fa-flask Pathway #9679;"];
    2 --> clust["fa:fa-snowflake-o Cluster #9679;"];
    2 --> multi["fa:fa-codepen Multivariate #9679;"];
    2 --> ml["fa:fa-university Model #9679;"];
    2 --> net["fa:fa-share-alt Network #9679;"];
   

    classDef green fill:#33a378, color:#fff, stroke:#33a378;
    classDef blue fill:#4472c4, color:#fff, stroke:#4472c4;
    class 1 blue;
    class 2 blue;
    class 3 blue;
    class 4 blue;
    class 5 blue;
    class 6 blue;
    class 7 blue;
    class 8 blue;
    class 9 blue;
    class data green;
    class preproc green;
    class stats green;
    class clust green;
    class multi green;
    class ml green;
    class path green;
    class report green;
    class net green;
    class vis green
DAVe is comprised of individual which can be linked to create a variety of unique data analysis workflows. Global Utilities include Data, Plot and Report which are used to manage data, interactively create plots and reports from assets generated with the data analysis.

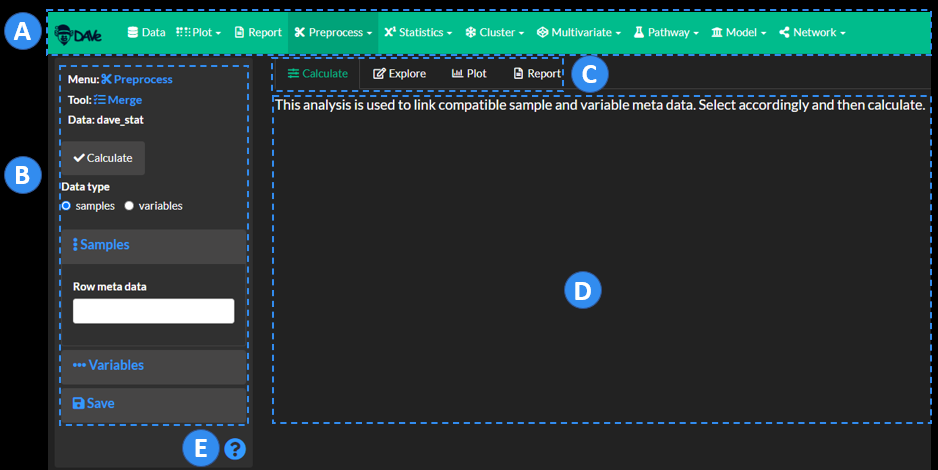
A Select

The navigation bar is used to select different analyses. Each analysis may also have sub-options. Typical workflows will include choosing modules from the nav bar progressing from left to right e.g. loading the data in Data and then formatting the data for analysis in the Preprocess module.


B Controls

The sidebar is used to select analyses methods, tune visualizations and specify report options.

C Workflows

The tabpanel can be used to progress through calculate, explore, plot and report analysis steps. The calculate tab is used to select method options and generate analysis results. The explore tab is used to create interactive plots to explore and summarize objects created in the calculate tab. The plot tab is used to fine-tune visualizations for the report. The report tab is used to collect all methods, results and plot settings and generate a report summarizing all of data analysis methods and results. Each module’s reports can be later combined and edited in the Report module.
See more workflow examples.

D Results

This is the main panel where calculation, exploration, plotting and report results will be output to. Results may include both static and interactive results which can be manipulated further.

E Help

Select this icon to to view instructions for each selected module and analysis workflow step.